2.4 Figures
2.4.1 Raster images
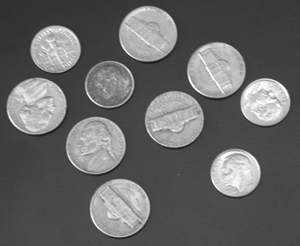
Figure 2.1 is a PNG image included with \includegraphics. The \img macro is set in preamble/SoM.tex, which you can change there if your graphics folder has a different name.
Use the command \alttext{alternative text} in a figure environment to provide informative alternative text for all your images — this is an important accessibility feature. Here is useful advice on writing good alternative text.
To avoid images being inverted in night mode in HTML, add \bmlPlusClass{bml_no_invert} after the \includegraphics command. There should be no linebreaks or spaces between. This can also be used for tikz images.
2.4.2 Vector images and diagrams
tikz images
Figure 2.2 is a tikz diagram included with \input.

2.4.3 xy diagrams
Figure LABEL:fig:xy shows an example of a diagram, reproduced from the BookML documentation.

pgfplots
PGF plots are also supported, as shown in Figure 2.4.

SVG
Unlike LaTeX HTML can render SVG images directly. If you have SVG images or diagrams as source files, this will produce a clearer image in the HTML version (for example, TikZ images are rendered as SVG). This can be done by using \iflatexml to include the SVG image in the HTML version, and the PDF image in the PDF version. This is done below. More information on how this works can be seen in Section 2.2.
